Risk measurement
Summary view
Global risk measure
For categorical variables
\(k\)-anonymity
The risk measure \(k\)-anonymity is based on the principle that, in a safe dataset, the number of individuals sharing the same combination of values (keys) of categorical quasi-identifiers should be higher than a specified threshold \(k\). \(k\)-anonymity is a risk measure based on the microdata to be released, since it only takes the sample into account. An individual violates \(k\)-anonymity if the sample frequency count \(f_{k}\) for the key \(k\) is smaller than the specified threshold \(k\). For example, if an individual has the same combination of quasi-identifiers as two other individuals in the sample, these individuals satisfy 3-anonymity but violate 4-anonymity. In the dataset, six individuals satisfy 2-anonymity and four violate 2-anonymity. The individuals that violate 2-anonymity are sample uniques. The risk measure is the number of observations that violates k-anonymity for a certain value of k, which is
where \(I\) is the indicator function and \(i\) refers to the \(i\)th record. This is simply a count of the number of individuals with a sample frequency of their key lower than \(k\). The count is higher for larger \(k\), since if a record satisfies \(k\)-anonimity, it also satisfies \((k + 1)\)-anonimity. The risk measure \(k\)-anonymity does not consider the sample weights, but it is important to consider the sample weights when determining the required level of \(k\)-anonymity. If the sample weights are large, one individual in the dataset represents more individuals in the target population, the probability of a correct match is smaller, and hence the required threshold can be lower. Large sample weights go together with smaller datasets. In a smaller dataset, the probability to find another record with the same key is smaller than in a larger dataset. This probability is related to the number of records in the population with a particular key through the sample weights.
In the summary view
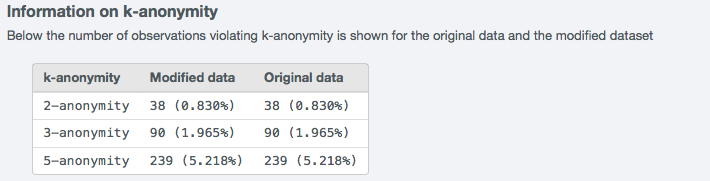
Fig. 28 Information on \(k\)-anonymity violators in summary view
Risk measures for numerical key variables
Household risk
If household identifier is selected, household risk will automatically be displayed.
Detailed view
The Risk/Utility tab provides more detailed information on risk measures and records at (high) risk.
Risky observations
SUDA
The SUDA algorithm identifies all the MSUs in the sample, which in turn are used to assign a SUDA score to each record. This score indicates how “risky” a record is. The potential risk of the records is determined based on two observations:
- The smaller the size of the MSU within a record (i.e., the fewer variables are needed to reach uniqueness), the greater the risk of the record
- The larger the number of MSUs possessed by a record, the greater the risk of the record
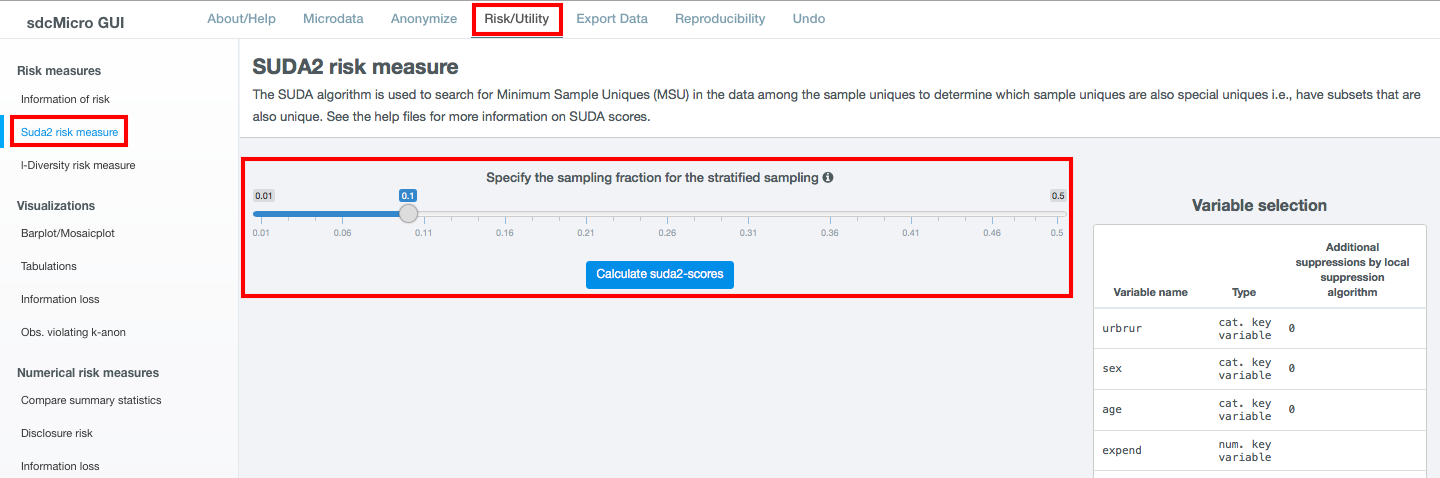
Fig. 29 Compute SUDA scores
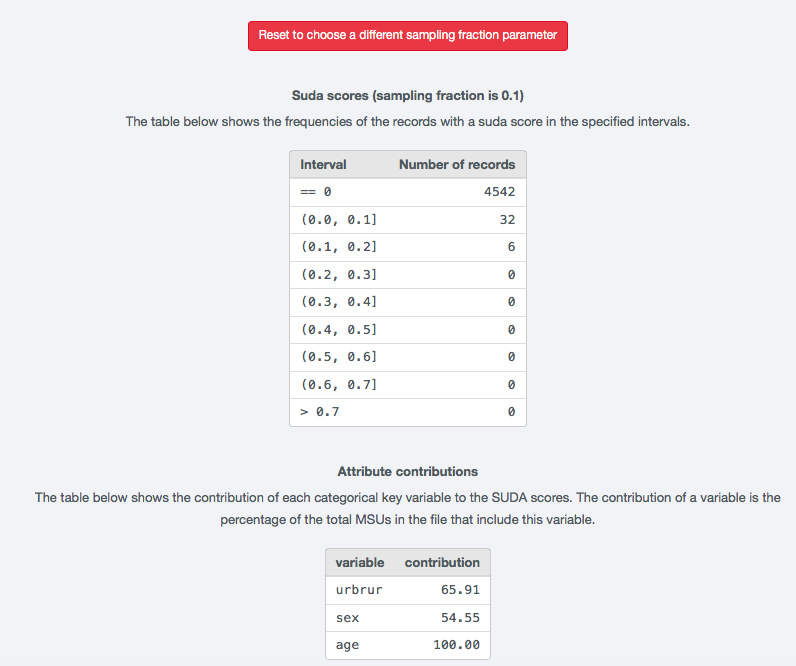
Fig. 30 Result of SUDA calculation
l-diversity
A dataset satisfies \(l\)-diversity if for every key \(k\) there are at least \(l\) different values for each of the sensitive variables. In the example, the first two individuals satisfy only 1-diversity, individuals 4 and 6 satisfy 2-diversity. The required level of \(l\)-diversity depends on the number of possible values the sensitive variable can take. If the sensitive variable is a binary variable, the highest level if \(l\)-diversity that can be achieved is 2. A sample unique will always only satisfy 1-diversity.
To compute \(l\)-diversity for sensitive variables in sdcApp
k-anonymity
Fig. 31 Information on \(k\)-anonymity violators for any level of \(k\)